Viscoelastic Characteristics of Porcine Liver
In this post, viscoelastic characteristics of the porcine liver are measured using rheological experiments. These data were needed for needle insertion experiments.
The contributors of this project are Mahdieh Babaiasl, and Fan Yang, under the supervision of Dr. John Swensen.
Sample Preparation for Rheological Tests
The porcine liver was obtained from the WSU’s meat science lab right after slaughter to avoid the changing of tissue properties. No authorization or approval was required since the liver was qualified to be food.
The liver is then put in the 0.9% Sodium Chloride solution (9g NaCl was dissolved in 700 ml water in a clean container and then water was added to bring total solution volume to 1000 ml) and ice to avoid drying out and swelling of the tissue during transportation.
Samples with 25 mm diameter and thickness of 2 mm were cut using knife and 1-inch cookie cutter.
Theory Beyond Oscillatory Rheology
Rheology is the science of stress-deformation relationships that deformation can be strain or strain rate. A rheometer applies deformation and measures the response of the material to that deformation. This relationship can be considered the property of the material, and from here, one can define the modulus and viscosity of the material:
In this equations, σ, γ, γ̇, and η are stress, shear strain, shear rate, and viscosity, respectively. The units for stress, shear strain, shear rate, and viscosity are Pascals (Pa), unitless (often described as %), 1/s, and Pa.s, respectively. Therefore, a rheometer can measure the viscosity and viscoelasticity of fluids, semi-solid, and solids.
There are two types of rotational rheometers, dual head or SMT and single head or CMT. In the dual head rheometer, the motor and transducer are separated, and the strain or rotation is applied in the bottom plate, and the stress is measured from the top plate.
This type of rheometer is strain-controlled. In the single head rheometer, the motor and transducer are together, and the bottom plate is stationary. The stress is applied, and the strain is measured by the displacement sensor. This type of rheometer is stress-controlled. Nowadays, with the invention of feedback control, both of these rheometers can shift between stress-controlled and strain-controlled modes.
Therefore a rheometer is a device that applies torque (stress) and measures the angular displacement (strain) or inputs and angular displacement (strain), and measures torque (stress). In conclusion, a rotational rheometer will apply or measure torque (force), angular displacement, or angular velocity.
In a rotational rheometer, shear stress can be measure from torque using the following equation:
In this equation, σ is shear stress in Pa, τ is torque in N.m, and cσ is a constant, which is called stress constant, and it is geometry-dependent.
The shear strain in a rotational rheometer is calculated from the angular displacement:
In this equation, γ, cγ and θ are shear strain, strain constant, which is geometry dependent, and linear motor displacement in radians.
There for shear modulus G can be defined as:
In this equation, τ∕θ is a characteristic of rheometer and cσ/cγ can be found from geometric shape constants that will be explained later.
Finally, in a rotational rheometer, shear rate can be calculated from the angular velocity using the following equation:
In this equation, ωm is angular velocity of motor in rad/s. Therefore, viscosity can be defined as follows:
τ∕ωm is a characteristic of the rheometer and cσ∕cγ can be computed from the geometry constants.
Different geometry options are available with every rheometer that has their own applications. One should refer to the user manual of the rheometer to choose the proper geometry for the desired applications. The geometry size can be chosen based on the viscosity of the sample.
One application of a rheometer is to measure the viscoelastic properties of materials. Viscoelasticity is the property of the material that exhibits both viscous and elastic properties.
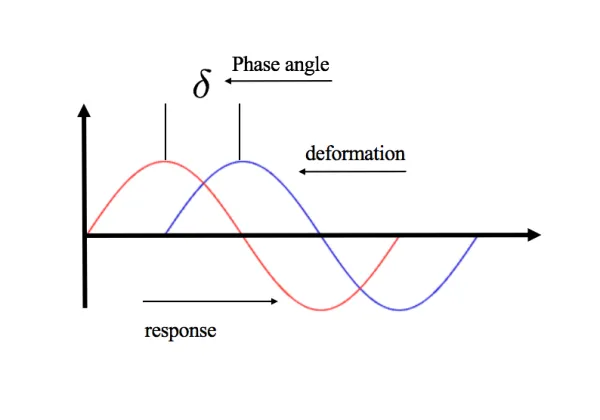
To measure the viscoelastic characteristics of a material, G’ (storage shear modulus), G” (viscous shear modulus), and tan(δ) should be plotted against time, temperature, and frequency as well as stress-strain curve. δ is the phase shift between deformation and response that is illustrated in the figure below.
Elastic behavior of an ideal solid can be described by the Hooke’s law of elasticity:
In which E is the modulus of elasticity. The stress-strain curve is a straight line, and the slope of this curve is the modulus. For purely elastic material or Hookean solid δ = 0, because the response is in phase with the applied oscillatory (sinusoidal) deformation.
Viscous behavior of an ideal liquid can be represented by the Newton’s law:
In this equation, η is the coefficient of viscosity. For an ideal fluid, the stress-shear rate curve is a straight line, and the slope of this line is the coefficient of viscosity. For purely viscous material (Newtonian liquid), δ = 90 deg, and this means that the response to applied sinusoidal deformation is 90 deg shifted.
Viscoelastic materials have behavior that is between purely viscous and purely elastic materials. In viscoelastic materials, force depends both on deformation and rate of deformation that can be expressed by the following formula:
Kevin-Voigt model and Maxwell model are two theoretical models that can be used to describe the behavior of a viscoelastic material.
For viscoelastic materials, the phase shift between the applied oscillatory deformation and measured response is between 0 and 90 deg (0<δ<90).
Viscoelastic materials can be characterized using different parameters. The first parameter that can be used to describe a viscoelastic material is complex, elastic, and viscous stress. Stress in a dynamic experiment is complex stress σ*, which has two components: elastic stress and viscous stress. Elastic stress is in phase with strain and can be expressed by the following formula:
The elastic stress shows how much material behaves like an elastic solid.
Viscous stress is in phase with strain rate and can be calculated by the following formula:
Viscous stress demonstrates how much the material behaves like an ideal liquid.
Therefore, complex stress can be expressed as follows:
The second property to describe a viscoelastic material is the complex modulus G*. Complex modulus can be stated as follows:
Complex modulus shows material’s overall resistance to deformation and has two components: elastic (storage) modulus (G’) and viscous or loss modulus (G”). Elastic (storage) modulus is defined as follows:
Elastic modulus measures the elasticity of the material and its ability to store energy. Viscous modulus can be represented by the following equation:
Viscous modulus shows the tendency of the material to dissipate energy (the energy is lost as heat). Therefore, the complex modulus can be expressed as follows:
Another property is tan(δ) = G”/G’ that measures material damping such as vibration or sound damping.
Complex viscosity (η*) is another property of the viscoelastic material that can be measured from oscillatory experiments in rheometers. Complex viscosity has two components: elastic component (η’) and steady-state viscosity (η’’).
In this formula, the frequency should be in rad/s.
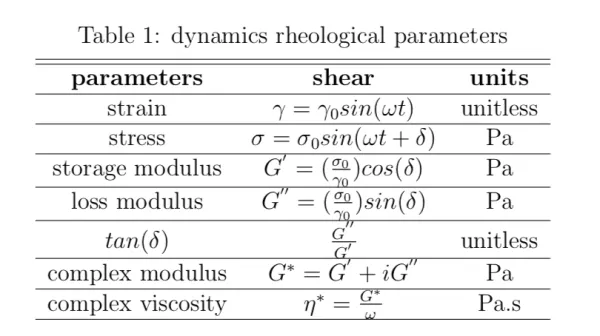
Table 1 presents dynamic rheological parameters discussed in a visual form.
There is an important note here to remember. Materials linear behavior as described by Hooke or Newton law is only valid on a small scale in stress or deformation. This region is known as Linear Viscoelasticity Region (LVR). In LVR, the response to small or slowly applied deformation can be found, and the magnitudes of stress and strain are related linearly.
Rheometer and Test Conditions
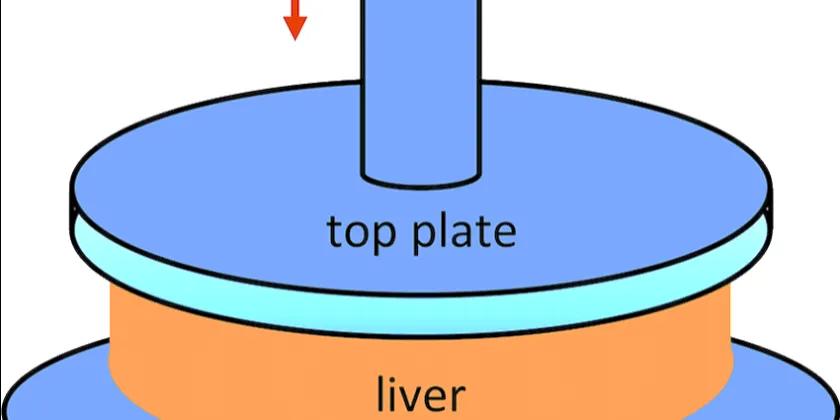
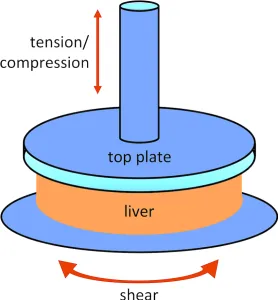
Rheological tests on the porcine liver were done using the TA discovery HR-2 rheometer. This is a CMT type rheometer, and thus it is stress-controlled, though it can also work in strain/ shear rate controlled mode with computer feedback. The geometry that we used for our tests is parallel plate geometry with 25 mm diameter. Parallel plate geometry is great for soft solids and gels.
Strain and Stress constants for parallel plates can be computed as follows:
In these equations, r and h are plate radius and distance between plates, respectively. For our experiments, the diameter of the geometry is 25 mm, and the gap is 2500 micrometers.
Together with the equations for stress and strain, these equations can be used to change machine parameters to rheological parameters.
Two sets of tests are performed on porcine liver samples: dynamic strain sweep and stress relaxation test. In the dynamic strain sweep test, the material response (stress) is monitored for various deformations (strain) at a constant frequency and temperature.
Because in needle insertion applications, the conditions are quasi-static and inertia effects are negligible, the tests are performed at 1 Hz or 6.28 rad/s frequency. The temperature is set to 37 deg C to mimic the body temperature. The strain was set in the range of 0.01 % to 8%.
From strain sweep, we can determine the range that the liver behaves linearly (LVR). In the linear region, the modulus is independent of the strain applied, and in the nonlinear region, the modulus is a function of the strain. In the linear region, the stress-strain curve has a constant slope which determines modulus. The strain from which the material’s response is nonlinear is called critical strain.
A stress relaxation experiment is a transient test that is performed to find the relaxation modulus of the material. In this test, strain is applied instantaneously to the sample and held constant over time, and stress is monitored as a function of time σ(t). The response of a purely elastic material to instantaneous constant strain over time (step strain) is constant for t>0. On the other hand, the response of purely viscous material will go to zero for t>0. For viscoelastic materials, the response to a step strain will decrease over time (it starts constant at first and then starts to decrease gradually).
For strains within the linear region (small deformations), the ratio of stress to strain is a function of time and is called stress relaxation modulus. Stress relaxation modulus is a property of the material and can be computed by the following formula:
We applied a 0.5% (this strain is within LVR of the liver) shear with a rise time of 0.02(s) to sample and monitored the relaxation behavior of the liver over 1000(s).
Rheological Results of Viscoelastic Characteristics of Porcine Liver
Rheological tests on the porcine liver were carried out on TA discovery HR-2 rheometer with parallel plate geometry with 25 mm diameter and 2500 micrometer gap between plates. For the strain sweep test, strains in the range of 0.01% to 8% are applied to the porcine liver samples, and the responses are measured. The frequency is set to be 1 Hz = 6.26 rad/s, and the temperature was constant throughout the test and was set to be 37 deg C. Strain sweep test was repeated 14 times to increase the accuracy of the data.
Figure 1 shows a log-log plot of storage (G’) and loss modulus (G”) against the applied strain (γ%). As it is evident from the figure, up to a certain amount of strain (~ 2%) that is called the critical strain, the modulus is independent of the strain applied and is constant. This region specifies the linear viscoelasticity region (LVR). In LVR, the strain is small or applied sufficiently slowly. After the critical strain, the modulus drops and is a function of strain applied. This region shows the nonlinear viscoelastic behavior. The error bars on the figure show one standard deviation (SD) above and below the mean value. The mean storage modulus (G’) for porcine liver in the linear behavior regime is ~ 45kPa, and the mean loss modulus (G”) is ~ 6.6kPa.
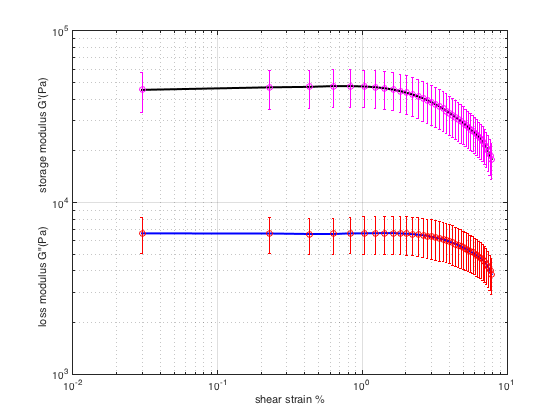
Figure 2 depicts stress (σ) vs. shear strain (γ). The stress (σ) is calculated from the toques (τ) applied by the motor with a scale that is dependent on the geometry, and the strain (γ) is calculated from the linear displacement (θ) with a geometry-dependent scale. The Torque-displacement curve is presented in Figure 3. From Figure 2, it can be seen that in the linear region, the stress is linearly increasing with strain and the slope of the curve is constant in this region. After the linear region, the slope of the curve is changing nonlinearly with a strain that indicates the porcine liver’s nonlinear behavior.
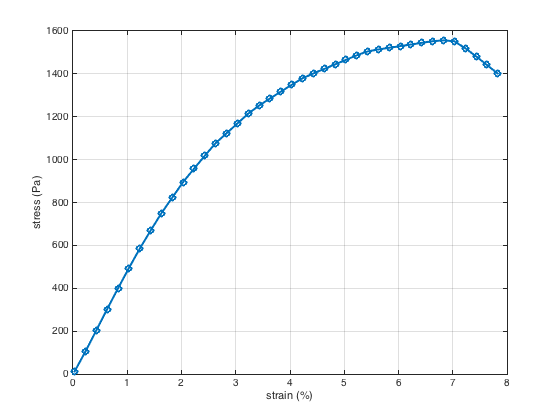
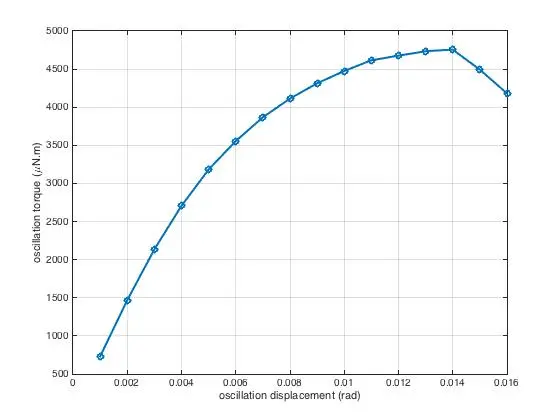
Figure 4 shows a log-log plot of complex viscosity (η*) and oscillation stress (σ) against applied shear rate (γ̇). As can be seen from this figure, complex viscosity and the slope of the stress-shear rate curve are constant in the linear region, and this shows that besides showing behavior that is related to an elastic solid, the porcine liver also shows behaviors typical of a viscous liquid and therefore it is indeed a viscoelastic material.
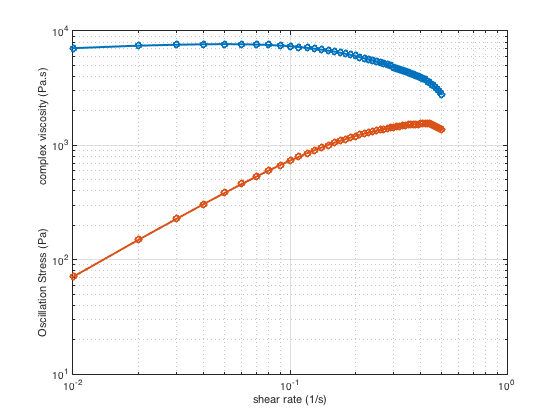
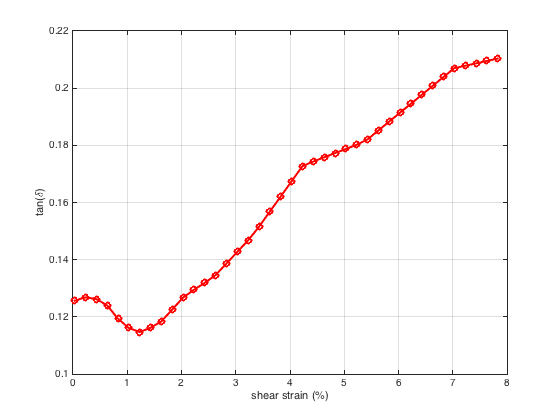
Figure 5 demonstrates tan(δ) vs. strain (γ). δ is the phase shift between deformation and response. For viscoelastic materials 0<δ<90, which is the case for porcine liver, all the phase shifts are within this limit. tan(δ) is a characteristic of viscoelastic material representing its damping properties and shows how a viscoelastic material absorbs and dissipates energy. The larger the tan(δ) value, the greater the dissipation of energy. As shown in Figure 5, for strains within the linear region, the tan(δ) value is small, and thus in this region, the loss modulus is small.
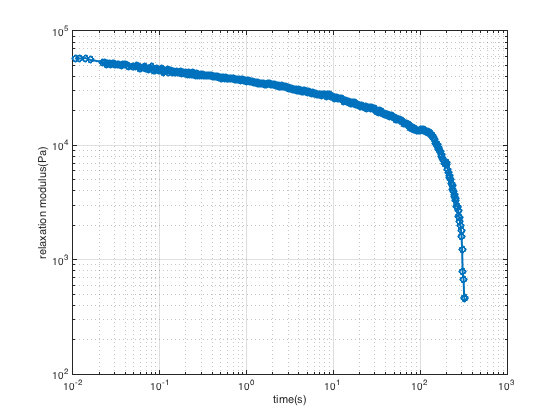
For the stress relaxation test, strain is applied instantaneously and held constant over time, and stress is monitored as a function of time σ(t). 0.5% strain (this strain is within LVR) is applied with a rise time of 0.02(s) (step strain) to sample, and the relaxation behavior of the porcine liver was monitored over 1000(s).
Figure 6 shows relaxation modulus (G(t)) vs. time. As it is obvious from this figure, the relaxation modulus decreased over time, and this reveals the viscoelastic characteristic of the porcine liver because if the porcine liver was purely elastic material, its response to instantaneous constant strain was constant over time, and if it was a purely viscous material, the response was zero for t>0. Therefore because the response decreases over time, we can conclude that the porcine liver has a viscoelastic behavior.